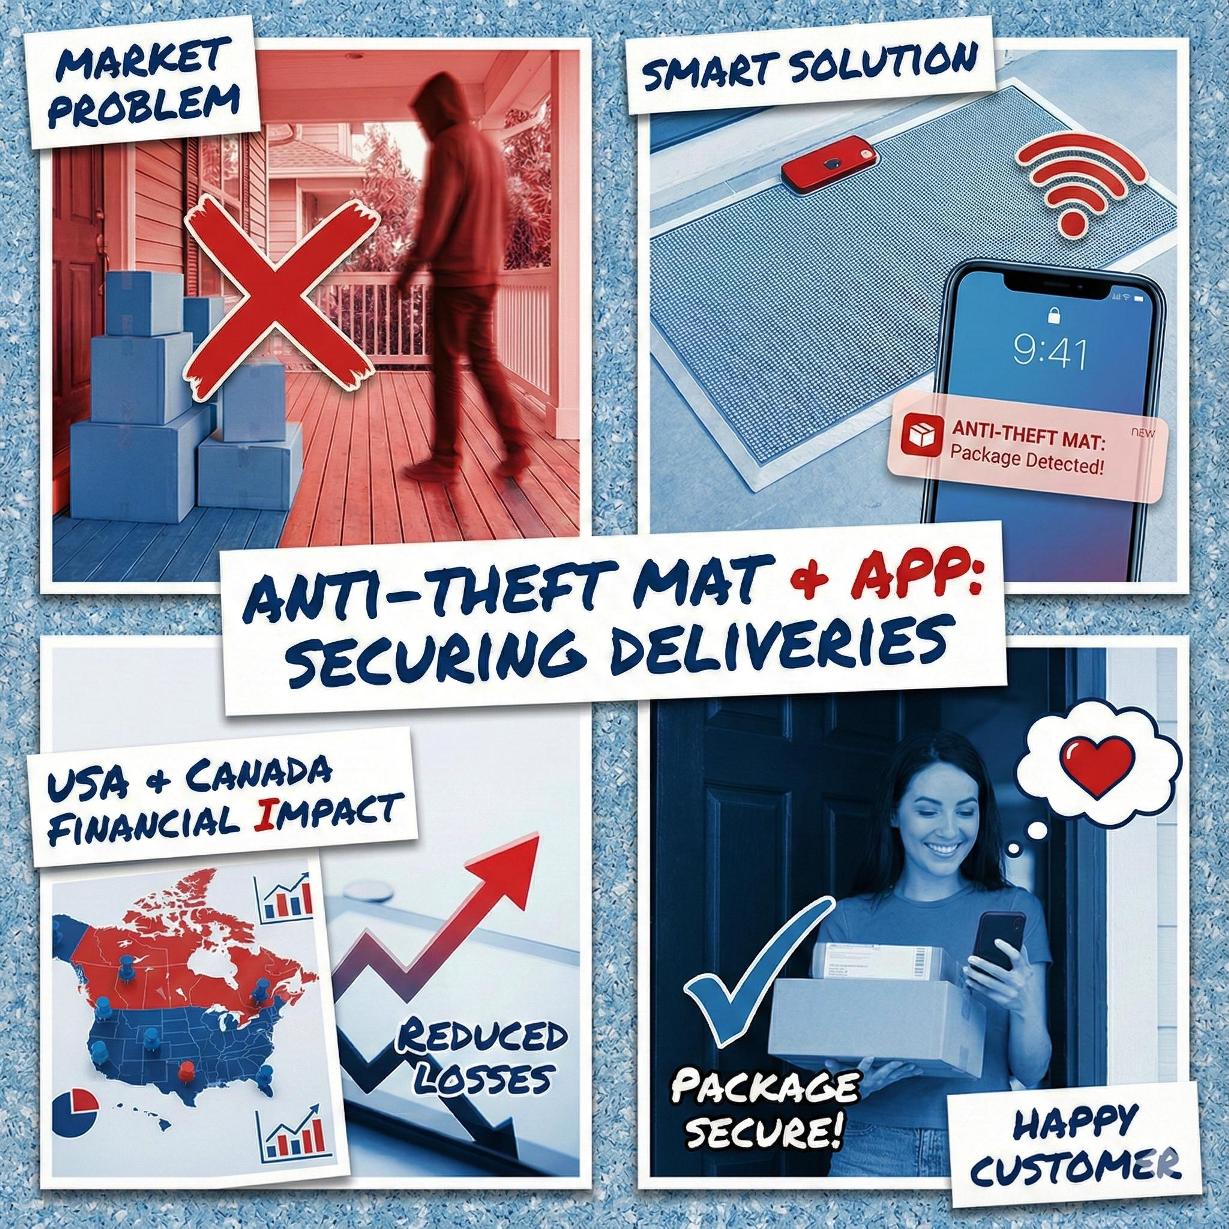
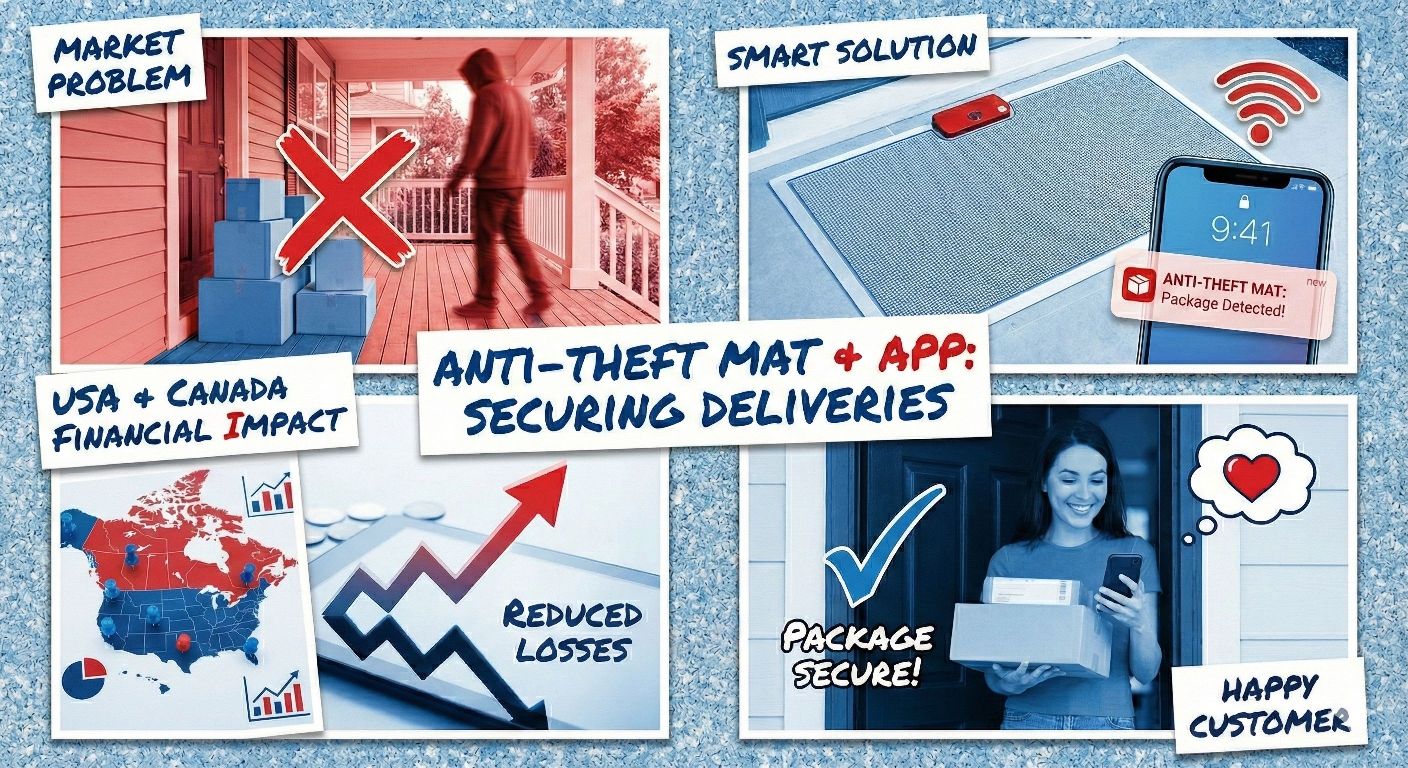
The rise of e-commerce has created a massive, yet underserved, market for physical delivery security solutions. The statistics below illustrate the scale of the package theft problem—and the size of the opportunity to solve it.


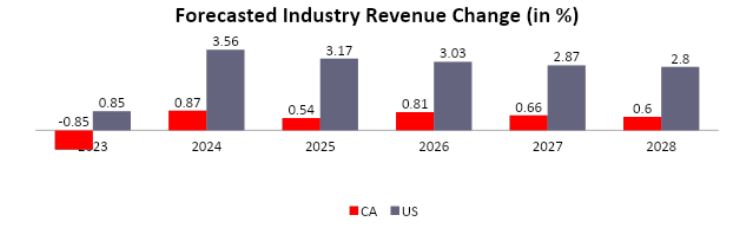
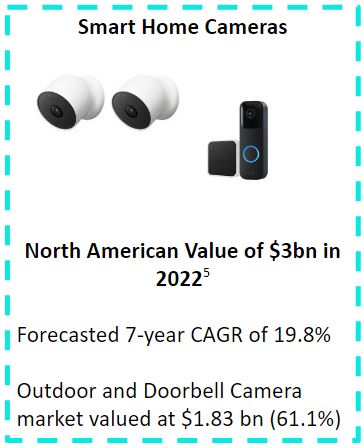
The Anti-Theft Mat is positioned to capture a share of this expanding market by offering a unique physical security layer that complements, rather than competes with, existing camera and alarm systems.
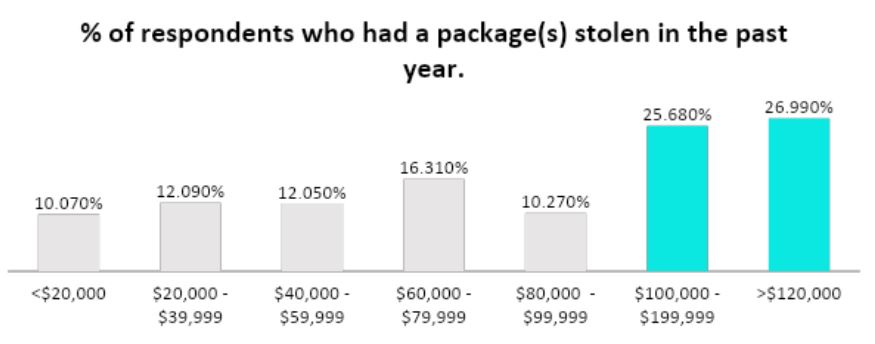
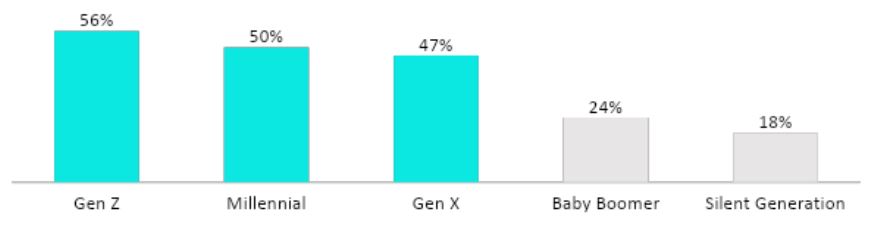
We are strategically targeting the most vulnerable and package-heavy demographic to maximize our initial impact and market penetration.

Victims in 3 Months

Average Loss per Theft
Million Stolen Annually
Fear Package Theft

In 2025, the landscape of e-commerce has shifted dramatically. Americans now spend over $1.47 trillion annually on e-commerce purchases, shipping more than 21.7 billion packages through a strained logistics network. While we have seen a slight dip in casual theft due to return-to-office trends, the value of stolen goods has skyrocketed. The average stolen package is now valued at $143, an 8% increase from previous years, making every delivery a higher-stakes gamble for homeowners.
Package piracy remains the number one property crime in North America. In the last 12 months alone, 104.3 million packages were stolen from U.S. porches. This isn't just a nuisance; it is a $37 billion economic crater affecting consumers and retailers alike. A shocking 31% of Americans fell victim to package theft this year, and 44% live in a state of high anxiety regarding their deliveries. Perhaps most tragic is the emotional cost: 12% of these stolen items were holiday gifts intended for family and friends.
Common advice often suggests installing a home alarm system or video doorbell. However, 2025 data reveals a "Camera Paradox": 60% of theft victims had a security camera installed. Cameras record the crime but rarely stop it. Thieves simply mask up and ignore them. Other solutions, like requiring signatures, are inconvenient for the 44% of workers who cannot be home during the day. Despite the prevalence of home security systems, less than 15% of thefts are reported to police due to the low probability of recovery.
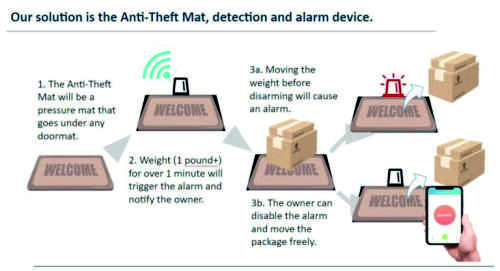
As thieves become bolder, passive monitoring is no longer enough. You need an anti theft mat that actively deters crime. Unlike a standard floor mat, the Anti-Theft Mat utilizes pressure mat technology to detect the presence of a package and arm itself. If a thief attempts to lift the package, a piercing wired alarm triggers immediately. This anti theft floor mat system provides the physical deterrent that cameras lack. While a sensormatic anti theft system protects retail stores, this mat brings that same level of active security to your doorstep. Currently, 14% of online shoppers take no precautions, making them easy targets. Don't be part of that statistic.
For those seeking the best home security system add-on, an anti theft doormat offers a low-tech, high-reliability solution that integrates seamlessly with your existing home security setup. It turns a vulnerable porch into a guarded zone.
Theft risk varies significantly by geography. Below is the breakdown of high-risk zones in the USA and Canada.
| State | Victims (Last 3 Mos) | Avg. Loss per Theft | Risk Level | Fear of Theft |
|---|---|---|---|---|
| Kentucky | 29.8% of households | $78.00 | Highest (Rank #1) | 25% Highly Concerned |
| Alaska | 10% (1 in 10) | $75.00 | +150% vs Avg | 30% Highly Concerned |
| Dist. of Columbia | 14% of residents | $160.00 | Extreme Urban Risk | 42% Highly Concerned |
| Texas | 8% (1 in 13) | $100.00 | +25% vs Avg | 33% Highly Concerned |
| Washington | 4% (1 in 25) | $75.00 | High | 26% Highly Concerned |
| Wyoming | 4% (1 in 25) | $182.00 | High Value Loss | 25% Highly Concerned |
| Region/Province | Victims (Last 12 Mos) | Trend Analysis | Fear/Anxiety Level |
|---|---|---|---|
| British Columbia | 19% of shoppers | High incidence of "tailgating" thefts | 72% Worried |
| Alberta | 15% (Est.) | Edmonton porch piracy up 47% | 68% Worried |
| Ontario | 22% of shoppers | Correlated with auto-theft rings | 69% Worried |
| Atlantic Canada | ~10% | Rising in urban hubs (Halifax) | 55% Worried |
| National Avg | 1 in 10 Canadians | 10% Drop in casual theft; rise in organized crime | 67% Worried |
When a package is stolen, the cost is not just the item itself. It involves shipping, customer service labor, and replacement goods. Below is the 2025 breakdown of the "Replacement Economy."
| Metric | Statistic (2025) |
|---|---|
| Total Lost Packages | 104,346,051 |
| Consumer Out-of-Pocket | $14.92 Billion |
| Retailer Replacement Cost | $22.00 Billion |
| Total Economic Impact | $37.00 Billion |
Retailers spend approximately $6.50 in labor for every claim processed.
23% of victims now report that retailers refused to refund or replace the stolen item.



Most wired alarms stop at the door. The Anti-Theft Mat extends your perimeter.
Get ProtectedBased on current CAGR of e-commerce volume vs. theft prevention adoption, here is the forecast for the next three years.
| Year | Projected Stolen Packages | Avg. Value per Package | Projected Retailer Cost | Return/Refund Rate Estimate |
|---|---|---|---|---|
| 2026 | 100 Million | $155.00 | $24 Billion | 75% Refunded |
| 2027 | 98 Million | $165.00 | $26 Billion | 65% Refunded |
| 2028 | 95 Million | $175.00 | $29 Billion | 60% Refunded |
Analysis: While the raw number of thefts may stabilize due to better security systems, inflation and the shipment of higher-value electronics will drive the total financial loss up. Retailers will likely tighten refund policies, shifting more cost to the consumer.
No. Statistics show 60% of victims had cameras. An antitheft door mat is a physical deterrent, whereas cameras are passive observers.
A pressure mat is a sensor placed under your doormat. When a package is placed on it, it arms. If the weight is removed without authorization, a wired alarm triggers.
Rarely. Less than 15% of thefts are reported, and arrest rates are low. Active prevention via an anti theft mat is superior to after-the-fact reporting.
It is becoming harder. In 2025, nearly 1 in 4 victims were denied a refund. You need a proactive home alarm system for your deliveries.
The logistics and e-commerce landscape of 2025 stands at a critical historical juncture. For nearly a decade, the narrative of "last-mile" delivery has been dominated by a singular, relentlessly rising metric: volume. However, the data from the 2024–2025 fiscal period signals a profound shift. For the first time in eight years, the United States has recorded a statistically significant decline in the raw volume of package theft incidents, dropping from a peak of approximately 120 million in 2023 to 104.3 million in 2025.
To interpret the recent decline in theft volume as a victory would be a dangerous oversimplification. While the frequency of casual, opportunistic theft has dipped—likely a result of return-to-office mandates reducing the "dwell time" of unattended parcels—the severity and sophistication of the remaining crimes have intensified. The average value of a stolen package has surged by 8.3% year-over-year to $143, driven by inflation and increasing consumer comfort with ordering high-value electronics.
The most headline-grabbing statistic of 2025 is the 13.4% year-over-year decline in stolen packages. However, the total economic impact has metastasized, reaching an estimated $37 billion annually when accounting for retailer replacement costs, logistics friction, and consumer loss. This report provides an exhaustive, 360-degree analysis of this phenomenon, synthesizing data from law enforcement agencies, major logistics carriers (FedEx, UPS, USPS), and proprietary security studies.
To understand the current state of package theft, we must first dissect the aggregate numbers that define the 2025 operating environment. The data reveals a complex paradox: fewer victims, but higher costs. While the "epidemic" phase of unchecked growth may be over, we have entered an "endemic" phase where theft is a stubborn, high-cost tax on the e-commerce economy.
A critical driver of the 2025 volume decline is the reduction in "dwell time"—the duration a package sits unattended on a porch. During the 2020–2022 era, the massive spike in theft correlated with the explosion of delivery volume. In 2025, consumers have adapted their behaviors. However, for the 31% of Americans who were victimized in the past 12 months, the experience remains jarring. Package theft remains the #1 most experienced crime in the United States, surpassing cybercrime and traditional property crime.
Total packages stolen dropped 13.4% to 104.3 Million, but average package value rose 8.3% to $143.00.


Consumers lost $14.92 Billion directly. While aggregate loss is down 6.3%, individual hits are harder due to inflation.
Retailers faced $22.0 Billion in losses, bearing hidden costs like customer service, reshipping, and brand damage.
Despite the decline, a staggering ~250,000 package theft crimes occur every single day in the U.S.
The holistic cost of package theft reached $37.0 Billion, rivaling the GDP of mid-sized nations.
31% of the population was affected in 2025, a 16% decrease, showing situational prevention is working.
1 in 10 Canadians reported package theft last year. In British Columbia, 72% of residents are worried about theft, creating a significant "Fear-Crime Gap."
Police crackdowns led to a 32.4% drop in auto theft in Quebec. However, OCGs are pivoting to cargo theft. Edmonton police reported a 47% increase in porch piracy in late 2024.
Halifax crime rates rose 6.3%. In Peel Region (Ontario), police busted a ring recovering 450 pieces of stolen mail, highlighting the organized nature of the threat.




Looking beyond 2025, the distinction between "physical theft" and "digital fraud" will vanish. Juniper Research predicts that global merchant losses from online payment fraud will exceed $343 billion. Criminals will move "upstream," hacking accounts to divert packages before they even ship.
Read Full ForecastAs the threat evolves, so too does the defensive technology. 2025 marks the realization that "passive" security is insufficient.

For the last five years, the video doorbell was sold as the ultimate deterrent. 2025 data proves this false. 60% of theft victims had a security camera. They are reactive, providing footage but rarely stopping the crime.
Cameras serve primarily as "evidence for a refund" rather than a shield.
Thieves simply mask up and ignore passive recording devices.
Recognizing the failure of passive recording, the market is shifting to "active" and "physical" solutions like AI Guarding and Physical Hardening.
Systems like SimpliSafe ActiveGuard use AI to trigger live agents who speak to thieves in real-time.
Physical barriers like the Anti-Theft Mat attack the "opportunity" aspect of the crime.


The proliferation of Amazon Hubs and third-party lockers is the ultimate solution, removing the package from the porch entirely, though sacrificing convenience.
Lockers remove the target entirely, offering perfect security.
They sacrifice the core value proposition of e-commerce: doorstep delivery.
Packages Stolen (2025)
Total Economic Impact ($)
Avg. Stolen Package Value
Americans Victimized
Theft is concentrated in high-density urban corridors. Top "Porch Pirate" capitals include Chicago (728 incidents/1000 households), New York City, Boston, Philadelphia, and Houston. However, states like Kentucky (+200% risk) and rural areas like Vermont also face high rates due to isolation.
The $37 billion impact is shared. Retailers spent $22 billion on replacement costs and labor. Consumers lost $14.92 billion directly. 23% of victims reported that the retailer refused to refund or replace the item in 2025.
Not really. 60% of theft victims had a security camera. Cameras are reactive; they record the crime but don't stop it. Active deterrents like AI guarding or physical mats/lockboxes are required for true prevention.
By 2028, we predict a tiered delivery ecosystem. High-value items will require secure chain-of-custody (lockers). Criminals will also move "upstream," using digital fraud to divert packages before they are even delivered.






The $37 billion impact of package theft cascades through the economy, affecting retailers, carriers, and consumers in distinct ways.
Retailers spent $22 billion replacing items. They must absorb original cost, shipping, replacement cost, and labor.
Read MorePolicies are tightening. In 2025, 23% of victims reported that the retailer refused to refund or replace the item.
Read More62% of shoppers feel anxious waiting for packages. This disrupts daily life and forces people to stay home.
Read More44% of victims shop online less, and 29% switch retailers after a theft, destroying lifetime customer value.
Read MoreFedEx and UPS are pivoting to "access points" to reduce liability, transferring risk to commercial locations.
Read MoreUSPS cites "fragmented reporting" as a major hurdle, lacking a centralized database to track theft trends.
Read MoreGet the full forecast report Contact Us




The "Wild West" era of unchecked growth in porch piracy appears to be closing. However, the "Victory" is pyrrhic. The $37 billion economic crater proves that remaining thieves are more professional and damaging. The future lies in breaking the link between "convenience" and "risk."
We have synthesized correlation tables based on the 2025 dataset, linking theft rates to various socio-economic and environmental factors.
High-Rise Urban (Lobby) carries a 3.0x Theft Risk Multiplier due to "tailgating" entry opportunities.
Row Houses carry a 2.5x Risk Multiplier due to street-facing exposure and high foot traffic.
2024-2025 saw a "Decoupling". E-commerce grew +9%, but theft declined -13% due to security measures.
Anomaly: 1.5x Risk. Extreme isolation in places like Alaska allows unobserved theft despite low density.
After years of double-digit growth, theft incidents dropped 13.4%. However, the average package value surged 8.3% to $143. Thieves are targeting high-value electronics and designer goods rather than household staples.

Urban residents are 18.8% more likely to be victimized. However, the gap is closing. Suburban residents are now only 10.6% less likely than average to be hit. Mobile thieves are commuting to suburbs to target higher-value deliveries.